 Contact support
When you start taking orders, that data gets collected on the SendOwl Analytics page. You'll be able to get many different snapshots of your sales activity.
Table of Contents:
Introduction
Here are some reasons you might like to use the Analytics page:
"I want to see how much income I've earned this week."
"I want to know what my best-selling products are at a glance."
"I want a quick look at how my discount codes performed last month."
Analytics vs. reports
Think of the Analytics page as a quick overview, where you can change the date range and see a snapshot of your income.
If you need more detailed reporting that you can export to a spreadsheet, SendOwl has many reports.
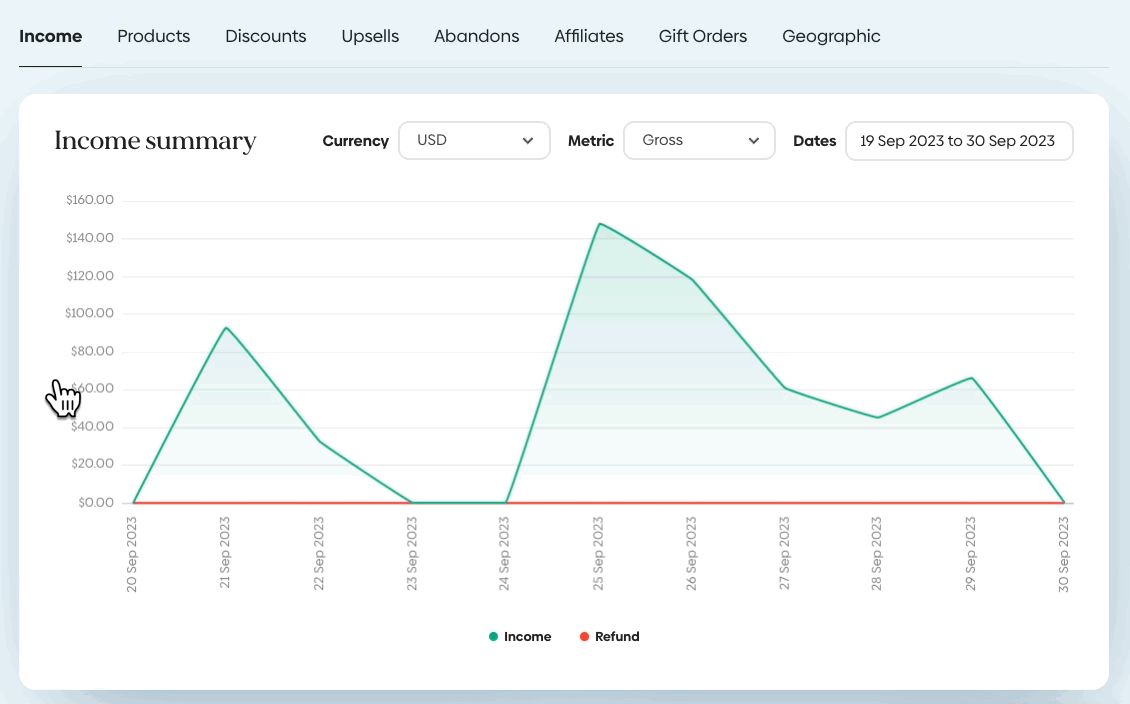
Setting a date range
SendOwl starts collecting data with your first sale. We'll display the last 30 days by default, but you can change to any date range you need:
On each graph, you can hover over any single date to see the data for that day:
If you're expecting to see analytics data but there isn't any displaying, the first thing to check is your date range.
Types of analytics you can view
Across the top of the page, you can click the tabs to see different kinds of analytics data:
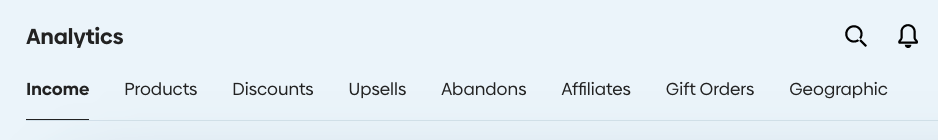
Some of these tabs will contain data, and some won't. It depends on which features of SendOwl you're using.
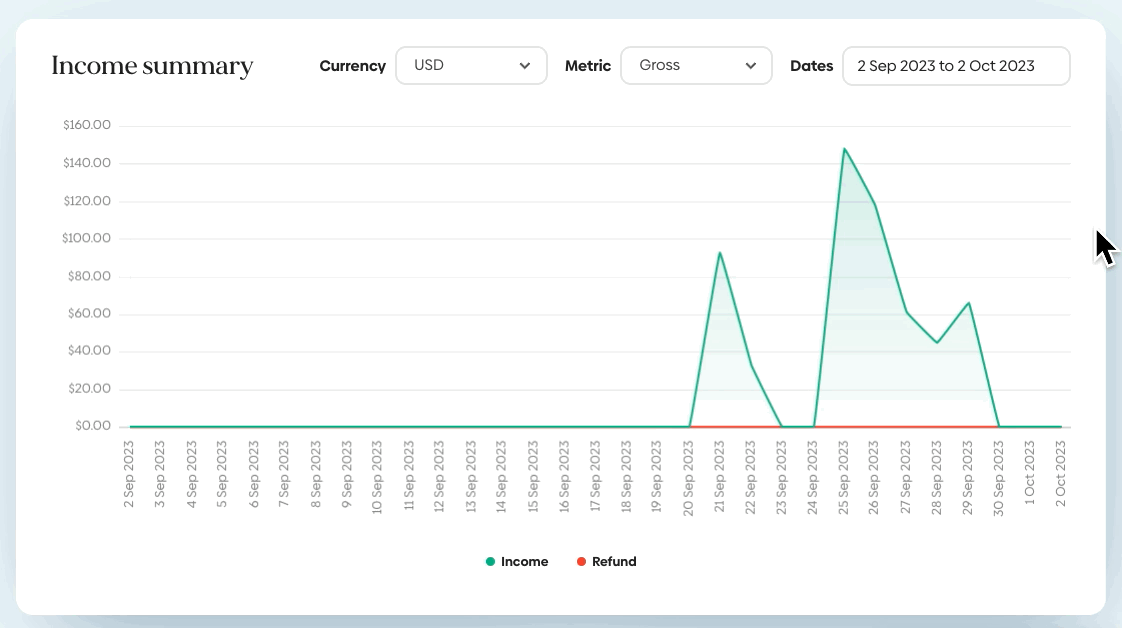
Income analytics
On the Income tab, you can get an overview of your income for specific days and date ranges.
There's also a graph of your best-selling products, and statistics on your orders during the date range.
If you sell any subscription products, SendOwl will display those in a separate graph alongside your one-time product sales. You'll also see refunds here, if you've issued any:

Product analytics
In the Products tab, you can track how each of your products sold during your date range.
The graph will display the daily total sales of all products. Below that is a table showing data for each product:
- How many orders were started vs. completed (also known as your Conversion rate).
- How many free products you issued
- Total income from each product for your date range
Discount analytics
This tab helps you track the discount codes you've shared during the date range.
The graph shows the total dollar amount of the discounts your buyers used each day.
Below that is a table of details about each discount code:
- How many orders were completed using each discount
- How much income came from orders using that discount
- The total amount that was discounted during the date range
Upsell analytics
You'll see data here if you're using upsells to offer more products during checkout.
The Upsells tab gives you data on how each upsell performed:
- How many orders took advangate of each upsell
- How much extra income each upsell created
Abandons analytics
If you're using the cart abandonment tool, you'll see data here. This tool sends special offers to buyers who begin an order but don't complete it.
The Abandons tab shows you:
- The daily income from buyers responding to the special offer and completing their order
- The total income amount from each of your upsell offers for the date range
- The total amount of any discounts you've included in your abandonment offers
Affiliates analytics
In the Affiliates tab, you'll see a snapshot of your SendOwl affiliate program.
The graph shows the total amount of daily sales that were made by your affiliate sellers.
The table displays stats on each affiliate:
- How many completed orders they generated in the date range
- How much income their orders brought in
- What the average value of their orders was for the date range
Gift order analytics
You'll see data here if you've enabled gift orders for your account.
This tab shows you:
- The total number of gift orders for the date range
- Your total income from gift orders for the date range
Geographic analytics
In the Geographic tab, you'll be able to see where your buyers are located.
In the map, hover over any country to see the total income from its buyers for your date range.
Below that is a table, listing all the countries your orders have come from. For each one, you'll see:
- The total orders that were started vs. completed
- The number of free orders from that country
- Average order value and total income for the date range